Manhattan & QQ plot
import pandas as pd
import numpy as np
import matplotlib.pyplot as plt
import seaborn as sns
from matplotlib import gridspec
from scipy.stats.mstats import mquantiles
from scipy.stats import beta
from scipy.stats import linregress
sum_stat = '/f/jianhua/nankai-hic/fine-mapping/prostate_cancer.txt'
chrom, bp, p = 'CHR','BP','P'
sep = '\t'
df = pd.read_csv(sum_stat,sep=sep)
---------------------------------------------------------------------------
FileNotFoundError                         Traceback (most recent call last)
<ipython-input-2-949a920fa523> in <module>
      2 chrom, bp, p = 'CHR','BP','P'
      3 sep = '\t'
----> 4 df = pd.read_csv(sum_stat,sep=sep)

~/anaconda3/envs/jb-book/lib/python3.8/site-packages/pandas/io/parsers.py in read_csv(filepath_or_buffer, sep, delimiter, header, names, index_col, usecols, squeeze, prefix, mangle_dupe_cols, dtype, engine, converters, true_values, false_values, skipinitialspace, skiprows, skipfooter, nrows, na_values, keep_default_na, na_filter, verbose, skip_blank_lines, parse_dates, infer_datetime_format, keep_date_col, date_parser, dayfirst, cache_dates, iterator, chunksize, compression, thousands, decimal, lineterminator, quotechar, quoting, doublequote, escapechar, comment, encoding, dialect, error_bad_lines, warn_bad_lines, delim_whitespace, low_memory, memory_map, float_precision, storage_options)
    608     kwds.update(kwds_defaults)
    609
--> 610     return _read(filepath_or_buffer, kwds)
    611
    612

~/anaconda3/envs/jb-book/lib/python3.8/site-packages/pandas/io/parsers.py in _read(filepath_or_buffer, kwds)
    460
    461     # Create the parser.
--> 462     parser = TextFileReader(filepath_or_buffer, **kwds)
    463
    464     if chunksize or iterator:

~/anaconda3/envs/jb-book/lib/python3.8/site-packages/pandas/io/parsers.py in __init__(self, f, engine, **kwds)
    817             self.options["has_index_names"] = kwds["has_index_names"]
    818
--> 819         self._engine = self._make_engine(self.engine)
    820
    821     def close(self):

~/anaconda3/envs/jb-book/lib/python3.8/site-packages/pandas/io/parsers.py in _make_engine(self, engine)
   1048             )
   1049         # error: Too many arguments for "ParserBase"
-> 1050         return mapping[engine](self.f, **self.options)  # type: ignore[call-arg]
   1051
   1052     def _failover_to_python(self):

~/anaconda3/envs/jb-book/lib/python3.8/site-packages/pandas/io/parsers.py in __init__(self, src, **kwds)
   1865
   1866         # open handles
-> 1867         self._open_handles(src, kwds)
   1868         assert self.handles is not None
   1869         for key in ("storage_options", "encoding", "memory_map", "compression"):

~/anaconda3/envs/jb-book/lib/python3.8/site-packages/pandas/io/parsers.py in _open_handles(self, src, kwds)
   1360         Let the readers open IOHanldes after they are done with their potential raises.
   1361         """
-> 1362         self.handles = get_handle(
   1363             src,
   1364             "r",

~/anaconda3/envs/jb-book/lib/python3.8/site-packages/pandas/io/common.py in get_handle(path_or_buf, mode, encoding, compression, memory_map, is_text, errors, storage_options)
    640                 errors = "replace"
    641             # Encoding
--> 642             handle = open(
    643                 handle,
    644                 ioargs.mode,

FileNotFoundError: [Errno 2] No such file or directory: '/f/jianhua/nankai-hic/fine-mapping/prostate_cancer.txt'
Reduce size
df['CHR'] = df['CHR'].replace('X',23)
df['CHR'] = df['CHR'].astype(int)
df['P'] = -np.log10(df['P'])
df['P_down'] = df['P'].round(1)
df['P'] = df['P'].round(3)
df['BP_down'] = df['BP']/5e6
df['BP_down'] = df['BP_down'].astype(int)
idx = np.random.permutation(np.arange(len(df)))
df = df.iloc[idx].drop_duplicates(['CHR','P_down','BP_down'])
df = df.sort_values(['CHR','BP'])
df['P'] = 10 ** -df['P']
def qq(data,ax,color):
    xmax = 0
    ymax = 0
    alpha = 0.9
    color = '#000000'
    n_quantiles = 100

    q_pos = np.concatenate([
        np.arange(99.) / len(data),
        np.logspace(-np.log10(len(data)) + 2, 0, n_quantiles)
    ])

    q_data = mquantiles(data, prob=q_pos, alphap=0, betap=1, limit=(0, 1))
    q_th = q_pos.copy()
    q_err = np.zeros([len(q_pos), 2])
    for i in range(0, len(q_pos)):
        q_err[i, :] = q_err[i, :] = beta.interval(
            alpha,
            len(data) * q_pos[i],
            len(data) - len(data) * q_pos[i])

    q_err[i, q_err[i, :] < 0] = 1e-15
    slope, intercept, r_value, p_value, std_err = linregress(q_th, q_data)
    xmax = np.max([xmax, -np.log10(q_th[1])])
    ymax = np.max([ymax, -np.log10(q_data[0])])

    ax.plot(
        -np.log10(q_th[n_quantiles - 1:]),
        -np.log10(q_data[n_quantiles - 1:]),
        '-',
        color=color)
    ax.plot(
        -np.log10(q_th[:n_quantiles]),
        -np.log10(q_data[:n_quantiles]),
        '.',
        color=color,
        label='gf')
    ax.plot([0, xmax], [0, xmax], '--k',color='#f42e30')
    ax.fill_between(
        -np.log10(q_th),
        -np.log10(q_err[:, 0]),
        -np.log10(q_err[:, 1]),
        color=color,
        alpha=0.1,
    )
def manhattan(df,ax):
    df[p] = -np.log10(df[p])
    df = df.sort_values(chrom)
    df_grouped = df.groupby((chrom))

    colors = ['#1A1A1A','#999999',]
    x_labels = []
    x_labels_pos = []
    end = 1000
    for num, (name, group) in enumerate(df_grouped):
        group[bp] = group[bp] + end
        end = group[bp].max() + 1000
        ax.scatter(group[bp], group[p],c=colors[num % len(colors)],s=1)
        x_labels.append(name)
        x_labels_pos.append(group[bp].mean())
    ax.axhline(y=-np.log10(5e-8), color='#2222FF', linestyle='-')
    ax.set_xticks(x_labels_pos)
    ax.set_xticklabels(x_labels)
#     print(df.loc[0,bp]-len(df)*0.1,end+len(df)*0.1)
#     ax.set_ylim([-0.5, df[p].max()*1.05])
# df = alldf.copy()
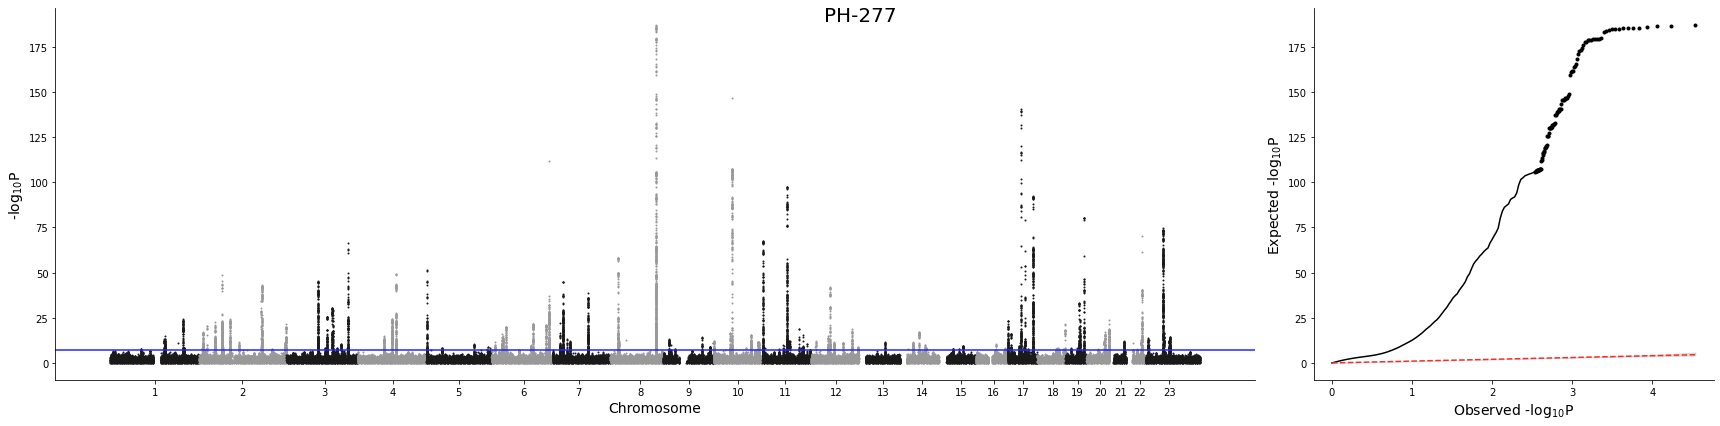
figure_tile = 'PH-277'
fig = plt.figure(figsize=(24, 6))
gs = gridspec.GridSpec(1, 2, width_ratios=[3, 1])
ax0 = plt.subplot(gs[0])
ax1 = plt.subplot(gs[1])
qq(df[p], ax1, 'b')
manhattan(df,ax0)
# ax0.set_xlim(left=-3e7,right=2.9e9)
ax0.set_xlabel('Chromosome', fontsize=14)
ax0.set_ylabel('-$\mathregular{log_{10}}$P', fontsize=14)
ax1.set_xlabel('Observed -$\mathregular{log_{10}}$P', fontsize=14)
ax1.set_ylabel('Expected -$\mathregular{log_{10}}$P', fontsize=14)
ax0.spines['right'].set_visible(False)
ax0.spines['top'].set_visible(False)
ax1.spines['right'].set_visible(False)
ax1.spines['top'].set_visible(False)
fig.suptitle(figure_tile, fontsize=20)
fig.tight_layout()
fig.savefig('{}_Manhattan_QQ.pdf'.format(figure_tile), dpi=300)
/f/jianhua/anaconda3/lib/python3.7/site-packages/ipykernel_launcher.py:22: RuntimeWarning: invalid value encountered in less
/f/jianhua/anaconda3/lib/python3.7/site-packages/ipykernel_launcher.py:33: RuntimeWarning: divide by zero encountered in log10
/f/jianhua/anaconda3/lib/python3.7/site-packages/ipykernel_launcher.py:40: RuntimeWarning: divide by zero encountered in log10
/f/jianhua/anaconda3/lib/python3.7/site-packages/ipykernel_launcher.py:11: SettingWithCopyWarning:
A value is trying to be set on a copy of a slice from a DataFrame.
Try using .loc[row_indexer,col_indexer] = value instead

See the caveats in the documentation: https://pandas.pydata.org/pandas-docs/stable/user_guide/indexing.html#returning-a-view-versus-a-copy
  # This is added back by InteractiveShellApp.init_path()